import pandas as pd
import matplotlib.pyplot as plt
df = pd.read_csv('https://bit.ly/anti-trans-tracker-csv')dfLoading...
df.info()<class 'pandas.core.frame.DataFrame'>
RangeIndex: 674 entries, 0 to 673
Data columns (total 19 columns):
# Column Non-Null Count Dtype
--- ------ -------------- -----
0 State 674 non-null object
1 Number 674 non-null object
2 Summary 673 non-null object
3 Bill Type 674 non-null object
4 Date 674 non-null object
5 Status 674 non-null object
6 Youth State Risk 674 non-null object
7 Adult State Risk 674 non-null object
8 Notes 365 non-null object
9 URL 674 non-null object
10 Sponsors 530 non-null object
11 Calendar 255 non-null object
12 History 526 non-null object
13 Manual Status 626 non-null object
14 Change Hash 527 non-null object
15 Bill ID 527 non-null float64
16 PDF 527 non-null object
17 Bill Analysis (AI Automated) 4 non-null object
18 Bill PDF 508 non-null object
dtypes: float64(1), object(18)
memory usage: 100.2+ KB
df.columnsIndex(['State', 'Number', 'Summary', 'Bill Type', 'Date', 'Status',
'Youth State Risk', 'Adult State Risk', 'Notes', 'URL', 'Sponsors',
'Calendar', 'History', 'Manual Status', 'Change Hash', 'Bill ID', 'PDF',
'Bill Analysis (AI Automated)', 'Bill PDF'],
dtype='object')sorting values
using sort_values() and value_counts(), with some of their arguments
df.sort_values('Youth State Risk')Loading...
We can use various parameters to customize the sort_values() function. You can see all of them on the docs entry for pandas
# inplace

df.sort_values('Bill Type', inplace=True)dfLoading...
# another way of saving the df is to set it to a new variable

sorted = df.sort_values(['Bill Type', 'State'])sorted.head(50)Loading...
risk = df.sort_values(['Youth State Risk', 'Bill Type'])risk.tail(50)Loading...
filtering by values: booleans and strings
df['Bill Type'] == 'Book Ban'169 False
334 False
187 False
283 False
171 False
...
266 False
245 False
487 False
503 False
117 False
Name: Bill Type, Length: 674, dtype: boolbooks = df['Bill Type'] == 'Book Ban'df[books]Loading...
Now you can ask questions like, Which states have the most book bans?
df[books].value_counts('State')State
Missouri 6
West Virginia 4
Idaho 4
Tennessee 4
Maryland 3
New Hampshire 3
Wyoming 3
Kentucky 2
Louisiana 2
Kansas 2
Mississippi 2
Nebraska 2
South Carolina 2
Georgia 2
Alabama 2
California 1
Iowa 1
Oklahoma 1
Pennsylvania 1
South Dakota 1
Indiana 1
Utah 1
Virginia 1
Name: count, dtype: int64df['Bill Type'].str.contains('Bathroom')169 False
334 False
187 False
283 False
171 False
...
266 False
245 False
487 False
503 False
117 False
Name: Bill Type, Length: 674, dtype: boolbathrooms = df['Bill Type'].str.contains('Bathroom')df[bathrooms].info()<class 'pandas.core.frame.DataFrame'>
Index: 42 entries, 397 to 252
Data columns (total 19 columns):
# Column Non-Null Count Dtype
--- ------ -------------- -----
0 State 42 non-null object
1 Number 42 non-null object
2 Summary 42 non-null object
3 Bill Type 42 non-null object
4 Date 42 non-null object
5 Status 42 non-null object
6 Youth State Risk 42 non-null object
7 Adult State Risk 42 non-null object
8 Notes 35 non-null object
9 URL 42 non-null object
10 Sponsors 34 non-null object
11 Calendar 18 non-null object
12 History 34 non-null object
13 Manual Status 41 non-null object
14 Change Hash 34 non-null object
15 Bill ID 34 non-null float64
16 PDF 34 non-null object
17 Bill Analysis (AI Automated) 1 non-null object
18 Bill PDF 34 non-null object
dtypes: float64(1), object(18)
memory usage: 6.6+ KB
df[bathrooms].value_counts('State')State
Missouri 7
Mississippi 6
South Carolina 5
West Virginia 3
Arizona 2
Georgia 2
Utah 2
Tennessee 2
Ohio 2
Oregon 1
Virginia 1
US 1
Alabama 1
Oklahoma 1
Alaska 1
Nebraska 1
Minnesota 1
Louisiana 1
Iowa 1
New Hampshire 1
Name: count, dtype: int64plotting data
df.plot()<Axes: >
df.plot(kind='bar')<Axes: >
df.value_counts('Bill Type').plot(kind='bar')<Axes: xlabel='Bill Type'>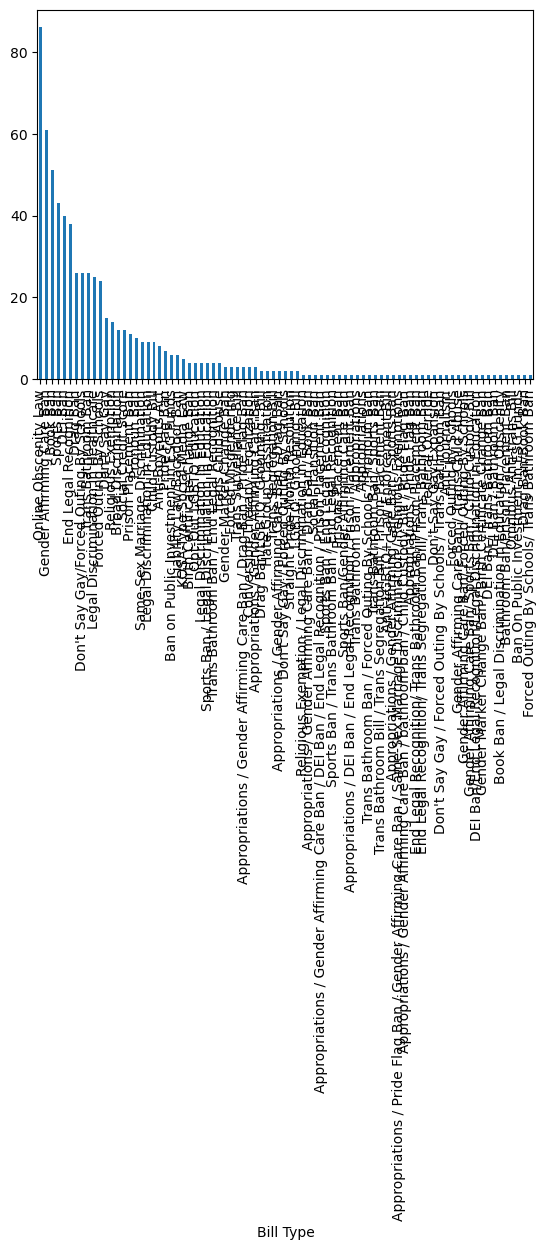
df.value_counts('Bill Type')Bill Type
Online Obscenity Law 86
Gender Affirming Care Ban 61
Book Ban 51
Sports Ban 43
DEI Ban 40
..
Bathroom Ban/Prison Placement Ban 1
Omnibus Anti-trans Bill 1
Ban On Public Investment in ESG Funds 1
Drag Ban/Book Ban 1
Forced Outing By Schools/ Trans Bathroom Ban 1
Name: count, Length: 83, dtype: int64df['Bill Type'].plot(kind='bar')---------------------------------------------------------------------------
TypeError Traceback (most recent call last)
Cell In[34], line 1
----> 1 df['Bill Type'].plot(kind='bar')
File /opt/anaconda3/lib/python3.11/site-packages/pandas/plotting/_core.py:1030, in PlotAccessor.__call__(self, *args, **kwargs)
1027 label_name = label_kw or data.columns
1028 data.columns = label_name
-> 1030 return plot_backend.plot(data, kind=kind, **kwargs)
File /opt/anaconda3/lib/python3.11/site-packages/pandas/plotting/_matplotlib/__init__.py:71, in plot(data, kind, **kwargs)
69 kwargs["ax"] = getattr(ax, "left_ax", ax)
70 plot_obj = PLOT_CLASSES[kind](data, **kwargs)
---> 71 plot_obj.generate()
72 plot_obj.draw()
73 return plot_obj.result
File /opt/anaconda3/lib/python3.11/site-packages/pandas/plotting/_matplotlib/core.py:499, in MPLPlot.generate(self)
497 @final
498 def generate(self) -> None:
--> 499 self._compute_plot_data()
500 fig = self.fig
501 self._make_plot(fig)
File /opt/anaconda3/lib/python3.11/site-packages/pandas/plotting/_matplotlib/core.py:698, in MPLPlot._compute_plot_data(self)
696 # no non-numeric frames or series allowed
697 if is_empty:
--> 698 raise TypeError("no numeric data to plot")
700 self.data = numeric_data.apply(type(self)._convert_to_ndarray)
TypeError: no numeric data to plotdf['Bill Type']169 Anti-Boycotts Act
334 Anti-Boycotts Act
187 Anti-Boycotts Act
283 Anti-Boycotts Act
171 Anti-Boycotts Act
...
266 Trans Segregation Bill
245 Trans Segregation Bill
487 Trans Surveillance Bill
503 Trans Surveillance Bill
117 Trans Surveillance Bill
Name: Bill Type, Length: 674, dtype: objecttype(df['Bill Type'][0])strtype(df.value_counts('Bill Type')[0])/var/folders/z6/8hbw1n6n3dq2jdw3_zjysj5sws21gh/T/ipykernel_7834/760123532.py:1: FutureWarning: Series.__getitem__ treating keys as positions is deprecated. In a future version, integer keys will always be treated as labels (consistent with DataFrame behavior). To access a value by position, use `ser.iloc[pos]`
type(df.value_counts('Bill Type')[0])
numpy.int64df.value_counts('Bill Type').plot(kind='bar')<Axes: xlabel='Bill Type'># method chaining: nlargest()
df.value_counts('Bill Type').nlargest(10).plot(kind='bar')<Axes: xlabel='Bill Type'>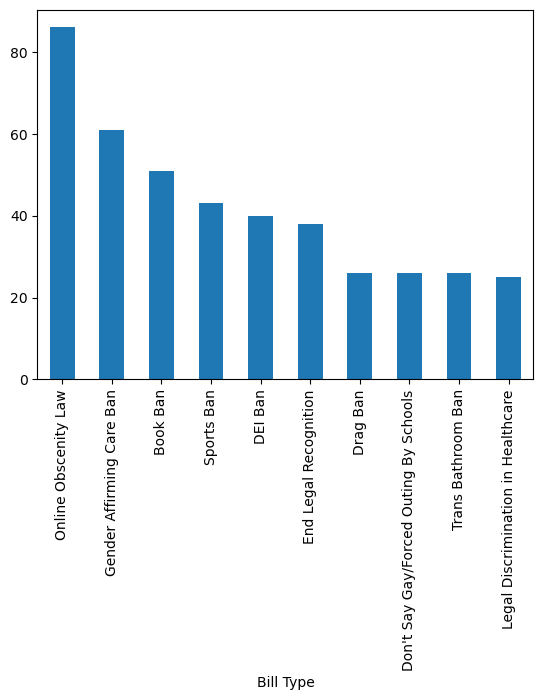
Looking into the pandasbarh, xlabel and title.
df.value_counts('Bill Type').nlargest(10).plot(kind='barh', xlabel='Number of Bills', title='Most Frequent Categories for Anti-Trans Bills')<Axes: title={'center': 'Most Frequent Categories for Anti-Trans Bills'}, xlabel='Number of Bills', ylabel='Bill Type'>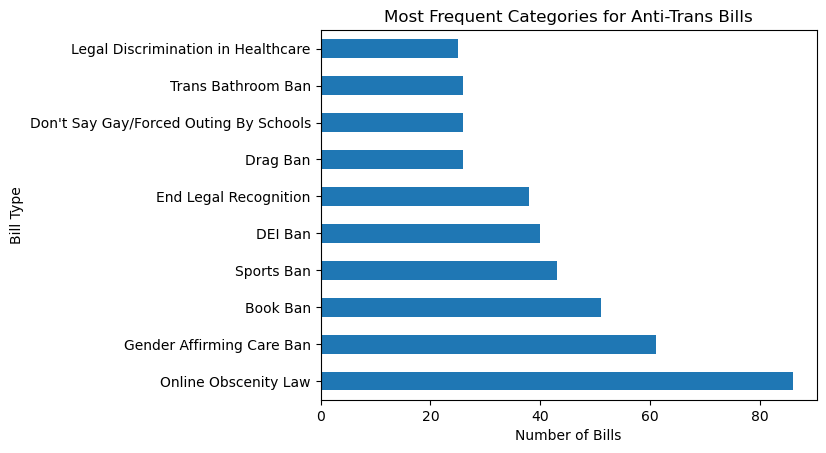
df.value_counts('Bill Type').plot(kind='pie')<Axes: ylabel='count'>
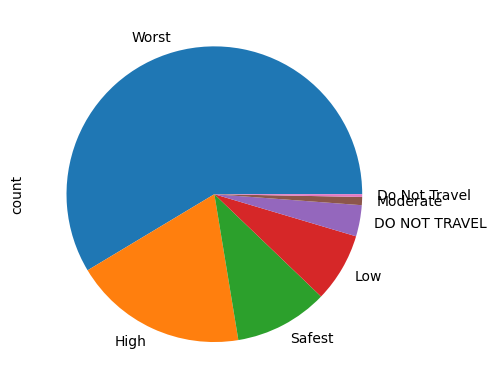
df.value_counts('Youth State Risk').plot(kind='pie')<Axes: ylabel='count'>